
Data snapshot: 2026-09-17T20:00:00+00:00. This analysis uses observed data, not a streaming quote.
What the observed move shows
The snapshot observed at 2026-09-17T20:00:00+00:00 records $TSLA at 366.20, a 2.267649687220734% increase versus the prior close of 358.08. The session opened at 367.48, reached a high of 374.12 and a low of 363.22, with reported volume 38,924,057. These figures indicate the stock was trading higher than the previous close during the sampled time and that buyers were active enough to push the price above the open toward the session high.
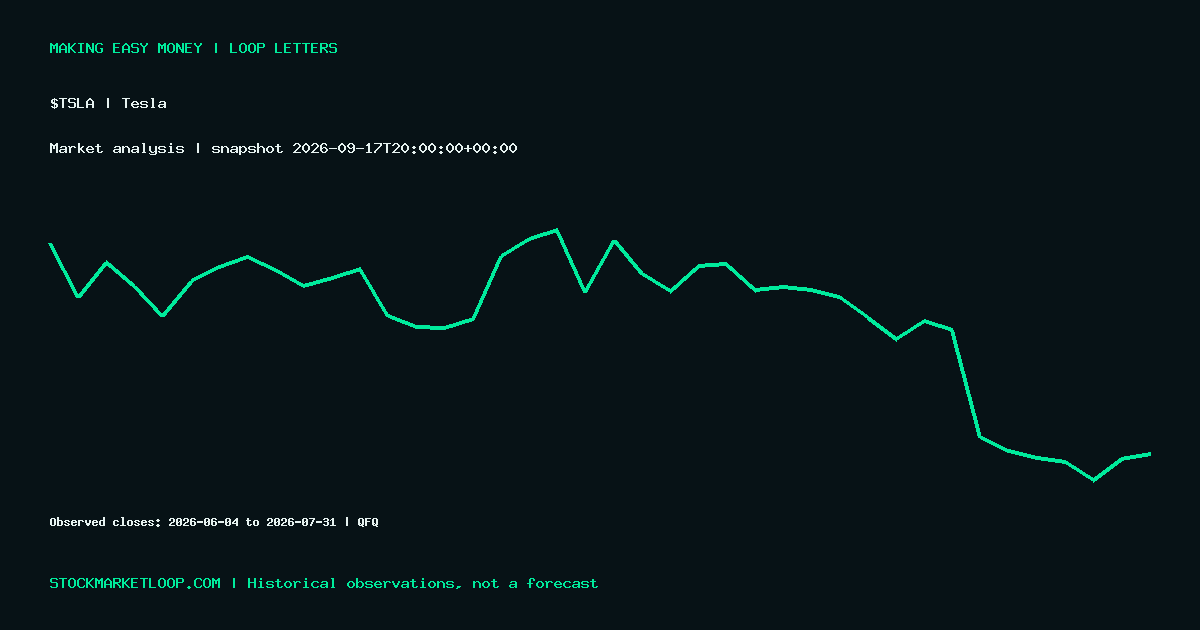
Within the provided bar history (adjustment: QFQ), price swings through June and July show notable intramonth movement. For example, the dataset includes a large single-day volume spike on 2026-07-23 with close 319.69 and volume 115,606,413, and a sequence of closes near the low-300s through the end of July (last bar 2026-07-31 close 311.21, volume 36,630,560). The snapshot sits above those late-July closes, so the observed 366.20 represents an appreciable gap higher relative to that period in the supplied bars.
What this does NOT establish
The snapshot alone does not establish a sustained trend change, a confirmed breakout, or that the move will continue beyond the captured time. The evidence is a single timestamped observation (observed_at: 2026-09-17T20:00:00+00:00) and must not be treated as ongoing intraday momentum without further sequential data.
It does not prove causes such as earnings, news, filings, analyst actions, or shifts in retail/institutional positioning—those items are not present in the supplied evidence. The historical bars may use different adjustments from the snapshot; direct like-for-like comparisons across dates should be avoided unless adjustment methodology is reconciled.
Conditional scenarios to watch
Scenario A — Continuation toward recent session high: If subsequent intraday prints and volume confirm movement above 374.12 recorded in the snapshot and sustain prices above the observed open (367.48), the move would appear to have immediate follow-through in the short run. This is a possibility, not a forecast, and requires additional timestamped evidence.
Scenario B — Pullback into the 360s or below prior close: If price falls back toward or below 358.08 in later prints while volume remains elevated, the snapshot rise would more likely be an intra-session fade rather than the start of a sustained rally.
Scenario C — Reversion toward late-July levels: If subsequent data show declining prices that approach the supplied late-July closes (e.g., 313.03 on 2026-07-24 or 311.21 on 2026-07-31) with increasing volume, the recent uptick would be a brief counter-move within a broader lower range recorded in the bars. Monitor follow-up price/time-stamped observations to distinguish among these possibilities.
Source and disclosure
View $TSLA market data on StockMarketLoop
AI-assisted analysis based on the timestamped source data shown above. Historical price action does not predict future returns. This is general market commentary, not personalized investment advice.
Discussion (0)