
Data snapshot: 2026-09-14T20:00:00+00:00. This analysis uses observed data, not a streaming quote.
What the observed move shows
The supplied snapshot timestamped 2026-09-14T20:00:00+00:00 records $INTC at $97.19, a decline of 5.5858% from a prior close of $102.94. The session opened at $95.82, reached an intraday high of $98.86 and a low of $94.5233, and shows a captured volume of 96,210,741.
This is a meaningful one-day drop in the snapshot: the price sits below the prior close and inside the day’s $94.5233–$98.86 range, indicating sellers were active during the session captured. The open below the prior close and the negative change_pct quantify that downward move on 2026-09-14 as recorded in the evidence.
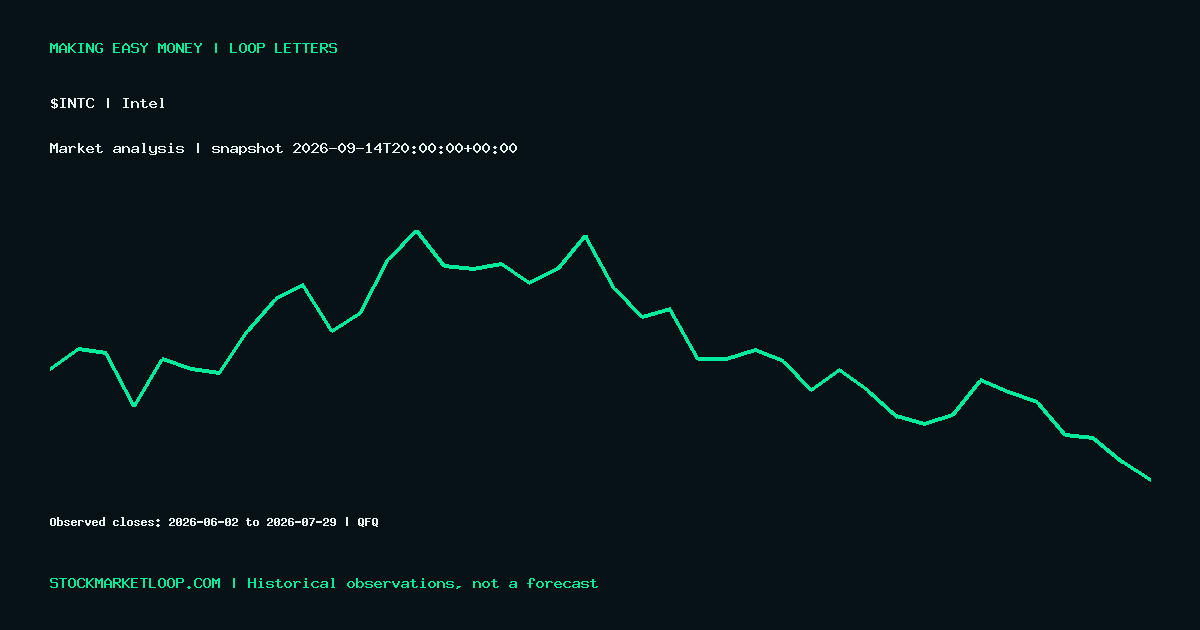
The historical bars in the supplied record show prior volatility for context: closing prints between $140.94 (2026-06-22) and $81.88 (2026-07-29) appear in the June–July sequence. Those past closes demonstrate the stock has traded through a broad range in recent months according to the provided bars, but those historical bars may use different adjustments than the snapshot and should not be treated as identical-series price continuity.
What this does NOT establish
The snapshot alone does not establish causation. No earnings, filing, news item, analyst action, or macro event is provided in the evidence, so any attribution of the decline to a specific catalyst would be unsupported.
It does not prove a persistent trend or a change in fundamentals. A single-session drop—even one of 5.59%—is an observation, not a forecast. The supplied volume figure (96,210,741) is a raw session number from the snapshot; without a validated baseline or comparative session volumes from the same data source and adjustment method, it cannot by itself confirm unusually high or low participation.
Comparisons between the snapshot and the historical bars must be cautious. The evidence notes the bars are QFQ-adjusted and that historical bars may use different adjustments; therefore treating them as perfectly like-for-like could be misleading.
Conditional scenarios to watch
Scenario A — Short-term stabilization: If subsequent snapshots (with timestamps) show $INTC holding above the intraday low near $94.52 and recovering toward the prior close of $102.94, the one-day decline at $97.19 could represent a transient pullback within the broader multi-month range shown in the bars.
Scenario B — Continued downside pressure: If following captures record new session closes below the provided intraday low ($94.5233) with volume at or above the captured 96,210,741 level, that would be consistent with escalating selling interest relative to this snapshot; such a sequence would need independent verification from later timestamped data.
Scenario C — Range-bound chop: Given the historical sequence of wide closes from $140.94 down to $81.88 in the supplied bars, prices could continue to oscillate within that broader band. Observing how future snapshots relate to both the $81.88 low and the $140.94 peak in the supplied history would clarify which side of that band is more relevant.
Each scenario is a possibility, not a forecast. Monitoring timestamped follow-ups and corroborating volume baselines from the same adjusted dataset is necessary before making substantive inferences.
Source and disclosure
View $INTC market data on StockMarketLoop
AI-assisted analysis based on the timestamped source data shown above. Historical price action does not predict future returns. This is general market commentary, not personalized investment advice.
Discussion (0)