
Data snapshot: 2026-09-15T20:00:00+00:00. This analysis uses observed data, not a streaming quote.
What the observed move shows
The snapshot at 2026-09-15T20:00:00+00:00 records $INTC at $100.46, a 3.417% increase versus the prior close of $97.19. Intraday range for the capture was $99.52 to $102.88, with an opening print of $98.83. Those figures indicate a single-session recovery from the prior close, with the session high extending roughly $5.69 above the prior close.
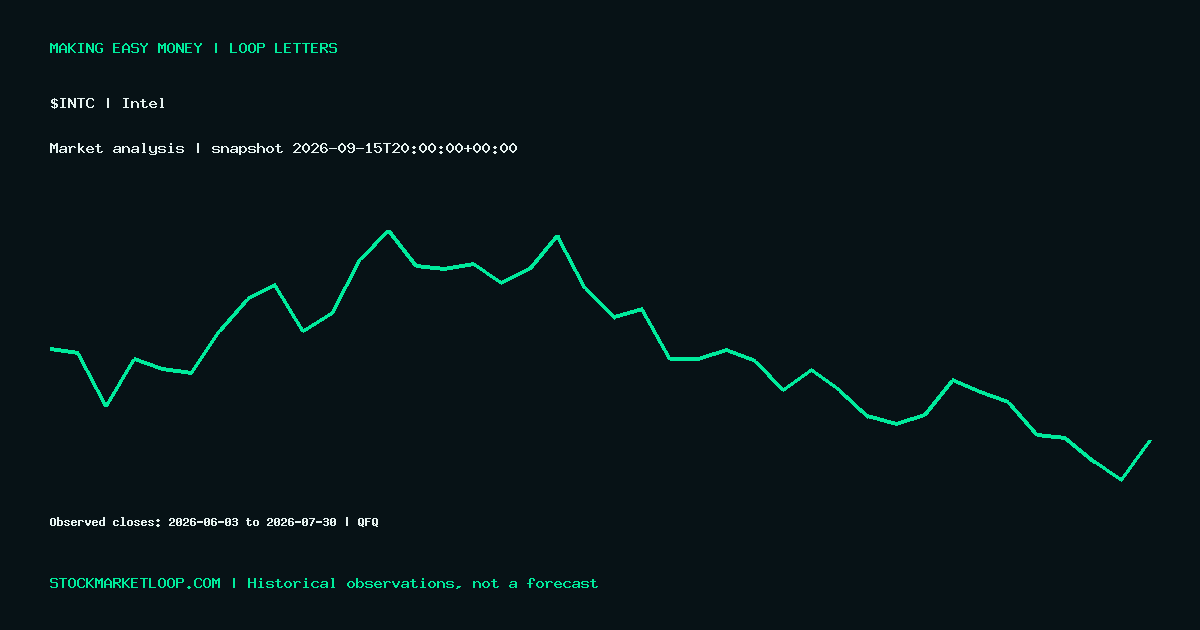
Volume for the snapshot session is shown as 3,350,716. The provided daily bars, last dated 2026-07-30, document pronounced volatility over June and July, with closes between a high of 140.94 (2026-06-22) and a low of 81.88 (2026-07-29) in the listed range. The recent snapshot price sits inside that broader mid-summer band rather than at extremes.
What this does NOT establish
A single-day uptick of 3.417% does not by itself prove a durable trend change, resume of prior uptrends, or reversal of the multi-week swings evident in the June–July bars. The snapshot provides no information on catalysts such as earnings, filings, news, analyst actions, or options activity; those items are not present in the supplied evidence and therefore are unknown.
The listed session volume (3,350,716) should not be treated as a statement about relative liquidity versus the historical daily volumes in the bars, which range from tens to hundreds of millions; those historical bars may use different adjustments and are not like-for-like with the snapshot session count. Support, resistance, or pattern claims and any crowd-sentiment inferences are not established by the data provided.
Conditional scenarios to watch (possibilities, not forecasts)
Bull-case possibility: If subsequent sessions sustain closes above $100.46 and push toward the session high of $102.88, that could signal follow-through buying on this uptick. Confirmation would require consecutive sessions with higher closes and explicit evidence of continued demand.
Neutral/mean-reversion possibility: The move could be a short-term bounce into the mid-summer range seen in June–July; absent further evidence, prices might re-test recent intraday lows near $99.52 or revisit the lower end of the July bars around the $80–$95 area recorded on 2026-07-24 to 2026-07-30.
Downside-risk possibility: Failure to hold above the prior close ($97.19) in coming sessions would reduce the significance of the 3.417% gain and could re-open the path toward prior July lows shown in the bars (e.g., $81.88 on 2026-07-29). Monitoring subsequent session ranges and volumes is necessary to assess which scenario is developing.
Source and disclosure
View $INTC market data on StockMarketLoop
AI-assisted analysis based on the timestamped source data shown above. Historical price action does not predict future returns. This is general market commentary, not personalized investment advice.
Discussion (0)