
Data snapshot: 2026-09-11T20:00:00+00:00. This analysis uses observed data, not a streaming quote.
What the observed move shows
On 2026-09-11 the snapshot reports $SOXL at 121.82, up 5.234968901174834% from the prior close of 115.76. The session range in the snapshot is 117.8656 to 124.5 with an open at 120.71 and reported volume of 53,039,073. That single-session advance and intraday range indicate a clear net positive price response within the snapshot's trading window.
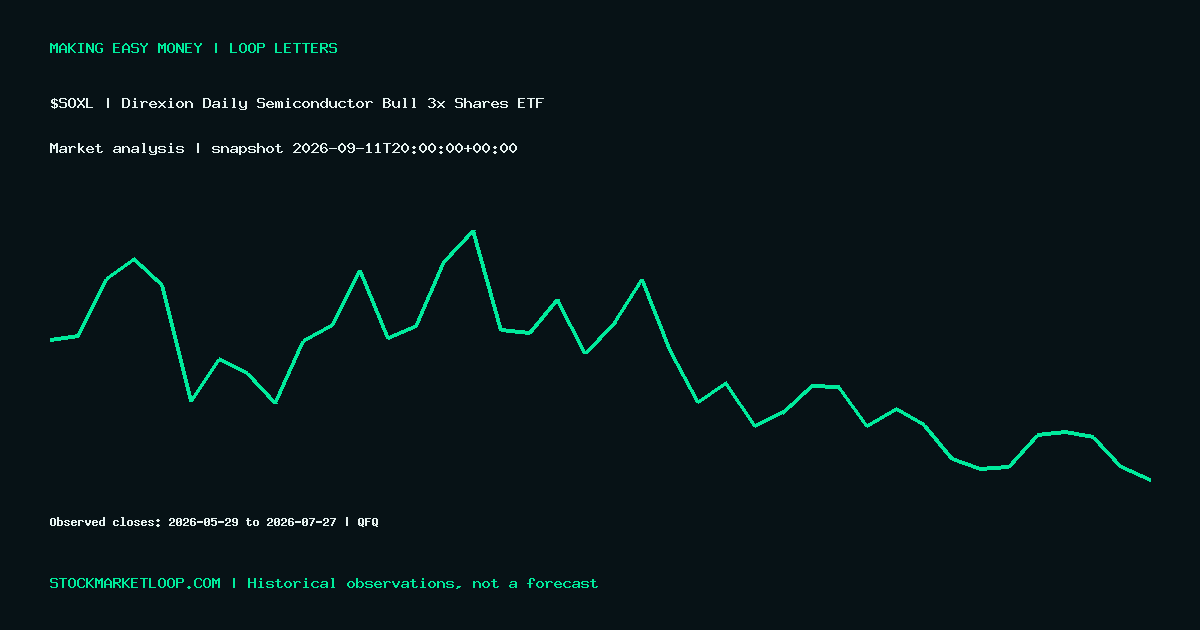
Placed against the adjusted daily bars (QFQ) earlier in 2026, the instrument has experienced large discrete moves: closes above 270 in June (for example 272.50 on 2026-06-15 and 300.77 on 2026-06-22) and sharp declines into mid-July (for example 135.47 on 2026-07-17 and 128.15 on 2026-07-27). The 2026 series shows substantial absolute changes in close prices across weeks and months, so the 5.23% uptick on 2026-09-11 occurs in the context of heightened price swings earlier in the year.
What this does NOT establish
A single-day advance does not prove a sustained trend or reversal. The snapshot is a time-stamped observation (as of 2026-09-11T20:00:00+00:00) and should not be treated as evidence of persistent direction without subsequent confirmations.
The historical bar series is adjusted (QFQ). Because historical bars may use different adjustments than the snapshot, direct like-for-like comparisons of absolute levels between the snapshot price and earlier adjusted closes is not a substitution for a full adjusted time-series analysis.
This note does not assert any causal driver — there is no earnings, news, filings, analyst view, or other event included in the supplied evidence. Absent such data, this price move cannot be attributed to a particular catalyst from the provided snapshot and bars alone.
Conditional scenarios to watch
Scenario A — Momentum continuation (possibility): If subsequent sessions after 2026-09-11 record additional net advances from 121.82, that would build evidence for a short-term continuation. Key observation would be whether sessions form a sequence of higher closes beyond the single 5.23% jump recorded here.
Scenario B — Failed follow-through (possibility): If prices reverse below the snapshot's intraday low of 117.8656 in the days after 2026-09-11, the session could be an intraday spike without follow-through. Confirmation would require observing closes back below the snapshot's prior close of 115.76 or sustained weakness versus the 121.82 mark.
Scenario C — Range-bound resumption (possibility): Given the earlier 2026 history of wide swings (for example closes ranging from about 300.77 in June to 128.15 on 2026-07-27), another plausible outcome is renewed volatility with prices oscillating around the 121.82 level rather than establishing a clear trend.
In all scenarios, use subsequent time-stamped snapshots and reconciled adjusted series before treating any single observation as definitive.
Source and disclosure
View $SOXL market data on StockMarketLoop
AI-assisted analysis based on the timestamped source data shown above. Historical price action does not predict future returns. This is general market commentary, not personalized investment advice.
Discussion (0)