
A Structure Read on $LWLG: Sweep, Reclaim, and the Path to $5.92
Price visited the stops, collected them and came back. My read on what that sequence implies for Lightwave Logic, Inc. Common Stock.

Listen: hear this article read aloud (about 2 min).
Lightwave Logic, Inc. Common Stock just ran the obvious level, took the stops and reversed.
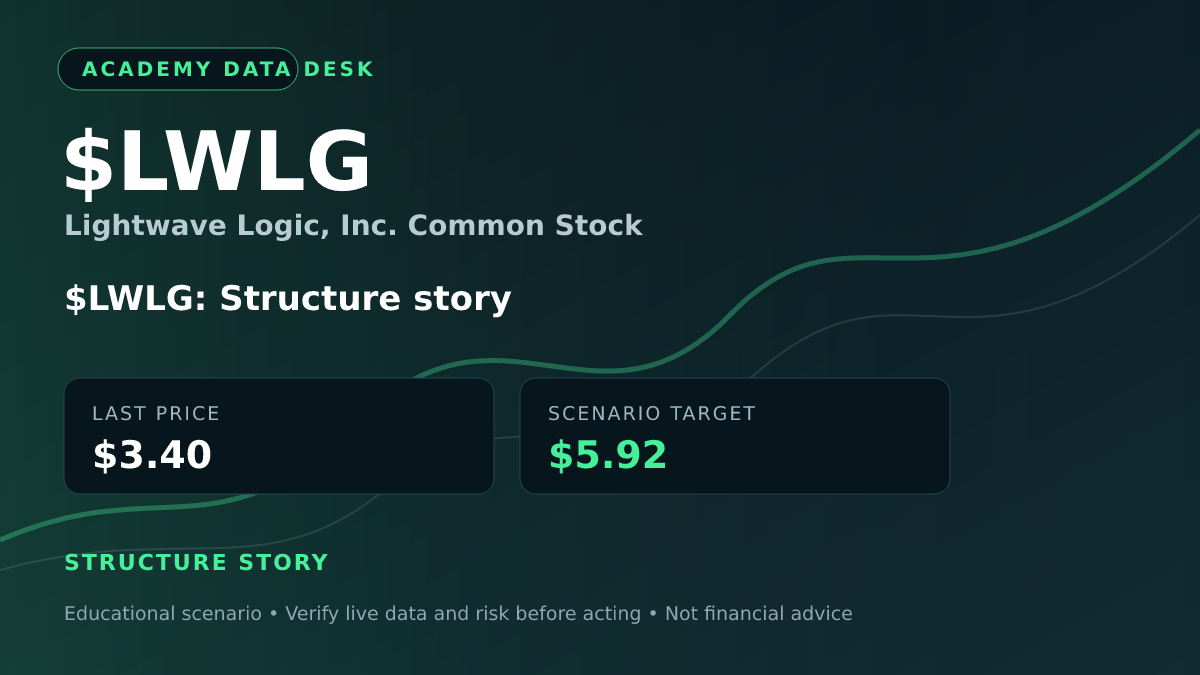
$LWLG sits at $3.40, $1.72 below its 20-day high of $5.12 and $0.05 above its 20-day low of $3.35.
My read: lean bullish. Buyers are close enough to force the issue, but I want volume before I call it a breakout.
What the sweep left behind
Against its own 60-session range, $LWLG is 49.3% below the high of $6.70 (Aug 19) and 1.5% above the low of $3.35 (Nov 11). $LWLG closed higher in 4 of its last 9 sessions.
Volume over the last five sessions averaged 1.1x the twenty sessions before them. The largest one-day move in the past twenty sessions was -21.6% on Nov 11.
Break of structure down through $3.55 on the daily chart.
Liquidity sweep: price ran the lows at $3.76 and closed back inside the range.
What I make of it: stops sit at obvious levels, and a sweep shows they were collected. What price does next shows whether the move was a trap or a start.
What the market looks to be pricing in
Order-flow analysis classifies the activity as accumulation, buyers in control, strength 100 of 100. Smart money is accumulating: absorbing sells, refilling bids, working buy orders without lifting price. Expect a markup once supply is exhausted. Off-exchange trading: NORMAL: $266K block at $3.55, -15% yesterday's biggest. Biggest single off-exchange print: 75,000 shares at $3.55, about $266K, on a downtick (seller hit). A print that size is one order being crossed away from the public book, not a crowd of small trades.
In options, dealers long gamma, call wall $5.00, put wall $3.00, gamma flip near $4.00, hedge pressure 0% of an average day's volume.
Days to cover 9.6, 30.0M shares short, short interest +6.9% since the last report. Squeeze risk 20 of 100; shorts pressing 54 of 100. Across the broader market, the read is Neutral (bias -1).
What I make of it: the pieces mostly point the same way as the price, which is more than I can say for most setups. None of them is proof.
The bull case
- Structure setup with a measured path to $5.92
- Order-flow read: accumulation, buyers in control, strength 100 of 100
The bear case
- Backdrop: Neutral (bias -1)
- Charts can be annotated after the fact
The part nobody is talking about
What I think traders are overlooking is how close the call wall sits to my target. The strike where the calls are stacked can pull price toward it or pin it there, and that makes it a level to watch, not a prediction.
The price alone doesn't show it.
If I'm right, and what proves me wrong
If $LWLG posts a retest of the supply block $4.21 to $4.97 that holds and volume expands, I think $5.92 becomes the next serious test. Under $3.72, I'm wrong.
The honest objection is selection bias. Sweeps that worked get remembered and the ones that failed don't, so any chart can be annotated into a story afterward.
That's the whole trade: a level to clear, a line that proves me wrong, and not much in between.
Kill switch
Any one of these and the thesis is over, no averaging down, no renaming it.
- A close through $3.72.
- Selling absorbs the buying at a key level and price loses it on volume.
- Order flow reverses: the sweeps and blocks turn to the other side.
- A scheduled event changes the picture before the trigger is reached.
What I'm watching
Buyers are close enough to force the issue. I want the volume before I call it anything more than a lean.
Desk record. 35 of 199 scenario targets traded before their invalidation (18%), 108 stopped out, 56 ran out of time, average outcome -0.37% per piece. Past pieces say nothing about this one.
The desk's scenario leans bullish. Bull or bear, the kill switch above is what keeps either view honest.
Sources and further reading: SEC EDGAR filings for LWLG · FINRA daily short sale volume files · Nasdaq short interest: LWLG · Cboe options quotes: LWLG · Lightwave Logic, Inc. Common Stock investor site · LWLG quote, chart and data on StockMarketLoop.
Data as of Nov 11, 9:56 AM ET: options positioning, FINRA short volume, the off-exchange trade record, the structure map, SEC filings and the ticker's headlines. Vaughn McNair (Grandmaster-Obi) and Making Easy Money may hold or trade positions in the names discussed. This is speculation and education, not financial advice.

Sign up now to get access to the library of members-only issues.
Free. Confirm by email. One click to leave.
Discussion (0)