
Data snapshot: 2026-09-18T20:00:00+00:00. This analysis uses observed data, not a streaming quote.
What the observed move shows
The captured snapshot for $CRWV (observed_at 2026-09-18T20:00:00+00:00) records a last price of $81.47, up 1.99% versus the prior close of $79.88. The intraday range in that snapshot was $79.84–$82 with an open at $79.83 and reported volume of 302,392 for the snapshot period.
Context from recent intraday and multi‑session history
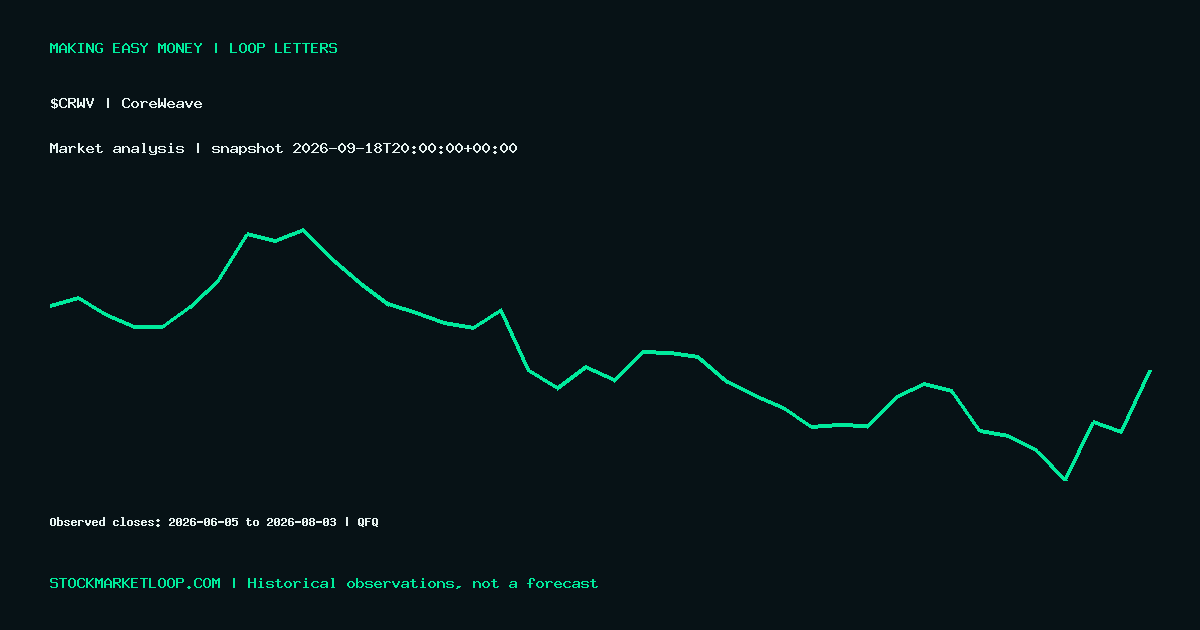
The snapshot move sits within a larger sequence of closes supplied in the bars: after mid‑June closes above $100 (e.g., $100.39 on 2026-06-05 and $117.03 on 2026-06-16), the provided series shows multiple lower closes through July with values as low as $60.82 on 2026-07-29, then a recovery into August with a close of $85.76 on 2026-08-03. The $81.47 snapshot on 2026-09-18 is within the range of the recent post‑July values (several closes in the $70s–$90s band). The snapshot's intraday high of $82 is near the reported close, indicating the captured session did not exhibit a materially extended high above that close.
What this does NOT establish
This single snapshot does not prove a durable trend reversal, a breakout, or a change in underlying fundamentals. The data does not include contemporaneous news, earnings, filings, or options activity, so no causal link can be established from the price alone. Volume in the snapshot (302,392) is a single-session figure; without a baseline or average‑volume comparator in the evidence, it cannot be interpreted as relatively high or low. Historical bar closes may reflect different adjustments from the snapshot (adjustment labeled QFQ), so direct like‑for‑like percentage comparisons across dates are not validated by the supplied evidence.
Conditional scenarios to watch (possibilities, not forecasts)
Scenario A — Stabilization within a range: If subsequent sessions continue to print closes near $80–$82 while intraday ranges remain tight, the recent price could be interpreted as short‑term stabilization following the larger swings seen in June–July. This is a possibility to monitor, not a forecast.
Scenario B — Renewed downward pressure: If prices move back toward the prior lower closes seen in late July (for example, the $60.82 close on 2026-07-29 or the sub‑$70 closes in late July), that would suggest the snapshot gain was transient. The supplied evidence does not show that move has occurred; it remains a scenario to watch.
Scenario C — Upward follow‑through: If prices in the next sessions exceed the snapshot intraday high ($82) and keep rising to levels nearer recent early‑June closes (noted at $100+ in the bars), that would represent distinct outperformance versus the snapshot. The evidence here does not show such follow‑through; it is only a conditional possibility.
Source and disclosure
View $CRWV market data on StockMarketLoop
AI-assisted analysis based on the timestamped source data shown above. Historical price action does not predict future returns. This is general market commentary, not personalized investment advice.
Discussion (0)