
$NBIS Looks Ordinary. Here's the Detail That Makes It Worth a Second Look
No headline, no catalyst. Just a stock doing something worth reading. My read on Nebius Group N.V. Class A Ordinary Shares.

Listen: hear this article read aloud (about 2 min).
No catalyst, no headline, and Nebius Group N.V. Class A Ordinary Shares is still worth a second look.
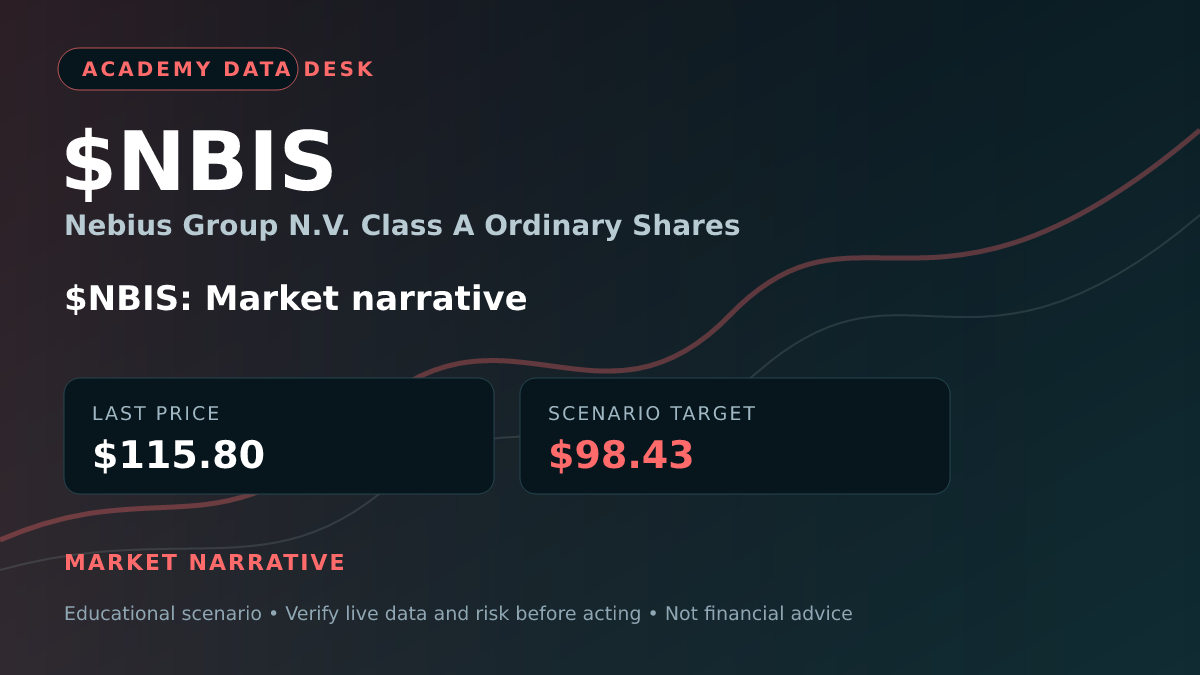
$NBIS sits at $115.80, $66.95 below its 20-day high of $182.74 and $6.80 above its 20-day low of $109.00.
My read: lean bearish. Sellers have the edge for now, but I want the floor to give before I say more.
Where the stock actually sits
Against its own 60-session range, $NBIS is 54.6% below the high of $255.10 (Oct 6) and 6.2% above the low of $109.00 (Nov 13). $NBIS closed higher in 4 of its last 9 sessions.
Volume over the last five sessions averaged 1.5x the twenty sessions before them.
The largest one-day move in the past twenty sessions was -16.8% on Nov 12. Price is below its 20-day average of $151.12 and below the 50-day at $194.60. The stock is -10.6% over five sessions and -30.0% over twenty.
What I make of it: nothing here is loud, and that's the point. The loud setups get crowded. This one hasn't been.
What the market looks to be pricing in
Off-exchange trading: HEAVY: $12.6M block at $115.60, 2.6x yesterday's biggest, high off-exchange share. Biggest single off-exchange print: 108,774 shares at $115.60, about $12.6M, on a downtick (seller hit). A print that size is one order being crossed away from the public book, not a crowd of small trades.
Across the broader market, the read is Lean bearish (bias -20). Insiders: quiet. On the daily chart, technical patterns include Double Top, outside_bar, spinning_top in a down trend.
What I make of it: the data agrees with itself more than it argues, and that counts for something. It still falls short of proof.
The bull case
- No catalyst identified
The bear case
- Market narrative setup with a measured path to $98.43
- Backdrop: Lean bearish (bias -20)
The part nobody is talking about
What I think traders are overlooking is how little room the thesis needs. The line that proves it wrong is close and the level it points to is not, which is the kind of imbalance I like to see.
The price alone doesn't show it.
If I'm right, and what proves me wrong
If $NBIS prints a close below $109.00 and volume expands, I think $98.43 becomes the next serious test. Above $123.90, I'm wrong.
The honest objection is that a build-up is obvious in hindsight and ambiguous in real time. Plenty of quiet ranges stay quiet, and nothing here is a catalyst.
That's the whole trade: a level to clear, a line that proves me wrong, and not much in between.
Kill switch
Any one of these and the thesis is over, no averaging down, no renaming it.
- A close through $123.90.
- Buying absorbs the selling at a key level and price reclaims it on volume.
- Order flow reverses: the sweeps and blocks turn to the other side.
- A scheduled event changes the picture before the trigger is reached.
What I'm watching
I lean lower, and I'd want the floor to give before I'd say more than that.
Desk record. 38 of 241 scenario targets traded before their invalidation (16%), 137 stopped out, 66 ran out of time, average outcome -0.14% per piece. Past pieces say nothing about this one.
The desk's scenario leans bearish. Bull or bear, the kill switch above is what keeps either view honest.
Sources and further reading: SEC EDGAR filings for NBIS · Nebius Group N.V. Class A Ordinary Shares investor site · NBIS quote, chart and data on StockMarketLoop.
Data as of Nov 13, 12:33 PM ET: options positioning, FINRA short volume, the off-exchange trade record, the structure map, SEC filings and the ticker's headlines. Vaughn McNair (Grandmaster-Obi) and Making Easy Money may hold or trade positions in the names discussed. This is speculation and education, not financial advice.

Sign up now to get access to the library of members-only issues.
Free. Confirm by email. One click to leave.
Discussion (0)