
The Options Book in $TSLA Is Doing Something the Chart Isn't Showing
Dealers who sold the calls have to hedge as price moves, and that can matter more than the chart. My read on where it leads.

Listen: hear this article read aloud (about 2 min).
The people who may move Tesla, Inc. Common Stock this week aren't traders. They're dealers hedging a book they didn't choose.
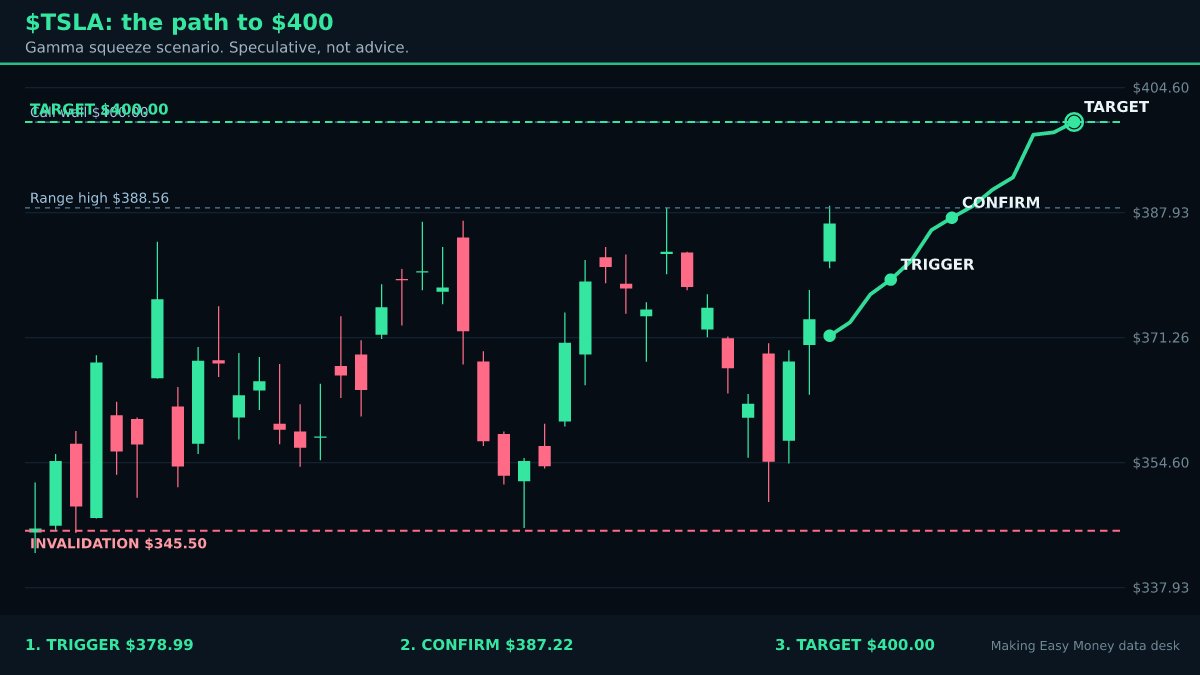
$TSLA sits at $371.50, $17.34 below its 20-day high of $388.84 and $25.62 above its 20-day low of $345.88.
My read: lean bullish. Buyers are close enough to force the issue, but I want volume before I call it a breakout.
The hedging nobody is looking at
Against its own 60-session range, $TSLA is 4.5% below the high of $388.84 (Oct 21) and 24.9% above the low of $297.38 (Jul 29). $TSLA closed higher in 4 of its last 9 sessions.
Volume over the last five sessions averaged 1.2x the twenty sessions before them.
The largest one-day move in the past twenty sessions was +4.7% on Oct 2. Dealers are short gamma on TSLA: they have to buy as it rises and sell as it falls, which is what turns a move into a run. On top of it, 60% of off-exchange prints were short sales: the gamma case and the short case are the same case here.
What I make of it: when the hedging runs the same direction as the price, it stops being background noise and starts being the move.
What is already in the price
Order-flow analysis classifies the activity as distribution, sellers in control, strength 72 of 100. Smart money is distributing: selling into strength, refilling asks, working sell orders while price looks fine. Expect a markdown once demand is exhausted.
Off-exchange trading: NORMAL: $1.9M block at $371.55, -50% yesterday's biggest. Biggest single off-exchange print: 5,000 shares at $371.55, about $1.9M, on an uptick (buyer lifted). A print that size is one order being crossed away from the public book, not a crowd of small trades. In options, dealers short gamma, call wall $400.00, put wall $130.00, gamma flip near $60.00, hedge pressure 0% of an average day's volume. Days to cover 1.9, 70.9M shares short, short interest +0.4% since the last report.
Squeeze risk 20 of 100; shorts pressing 42 of 100.
Across the broader market, the read is Neutral (bias -7).
What I make of it: the data agrees with itself more than it argues, and that counts for something. It still falls short of proof.
The bull case
- Gamma squeeze setup with a measured path to $400.00
The bear case
- Order-flow read: distribution, sellers in control, strength 72 of 100
- Backdrop: Neutral (bias -7)
- Dealer positioning is inferred, not observed
The detail that changes the read
What I think traders are overlooking is how close the call wall sits to my target. The strike where the calls are stacked can pull price toward it or pin it there, and that makes it a level to watch, not a prediction.
That part doesn't show up on the chart.
The call, and the line that breaks it
If $TSLA posts a push through $400.00 on volume and volume expands, I think $400.00 becomes the next serious test. Under $345.50, I'm wrong.
The honest objection is that open interest shows contracts, not who holds which side, so any dealer map is an inference. Strikes with heavy interest get crossed without a ripple more often than people admit.
So the plan is simple. Wait for the level, wait for the volume, and respect the line.
Kill switch
Any one of these and the thesis is over, no averaging down, no renaming it.
- A close through $345.50.
- Selling absorbs the buying at a key level and price loses it on volume.
- Order flow reverses: the sweeps and blocks turn to the other side.
- A scheduled event changes the picture before the trigger is reached.
Where I land
I lean higher, not loudly. The setup earns the lean and not the conviction, and it gets the conviction only when volume shows up.
Desk record. 5 of 13 scenario targets traded before their invalidation (38%), 8 stopped out, 0 ran out of time, average outcome +9.73% per piece. Past pieces say nothing about this one.
The desk's scenario leans bullish. Bull or bear, the kill switch above is what keeps either view honest.
Sources and further reading: SEC EDGAR filings for TSLA · FINRA daily short sale volume files · Nasdaq short interest: TSLA · Cboe options quotes: TSLA · Tesla, Inc. Common Stock investor site · TSLA quote, chart and data on StockMarketLoop.
Data as of Oct 22, 7:36 AM ET: options positioning, FINRA short volume, the off-exchange trade record, the structure map, SEC filings and the ticker's headlines. Vaughn McNair (Grandmaster-Obi) and Making Easy Money may hold or trade positions in the names discussed. This is speculation and education, not financial advice.

Sign up now to get access to the library of members-only issues.
Free. Confirm by email. One click to leave.
Discussion (0)