 ORDER FLOW$NVDANvidia CorpOpen ticker analysis →
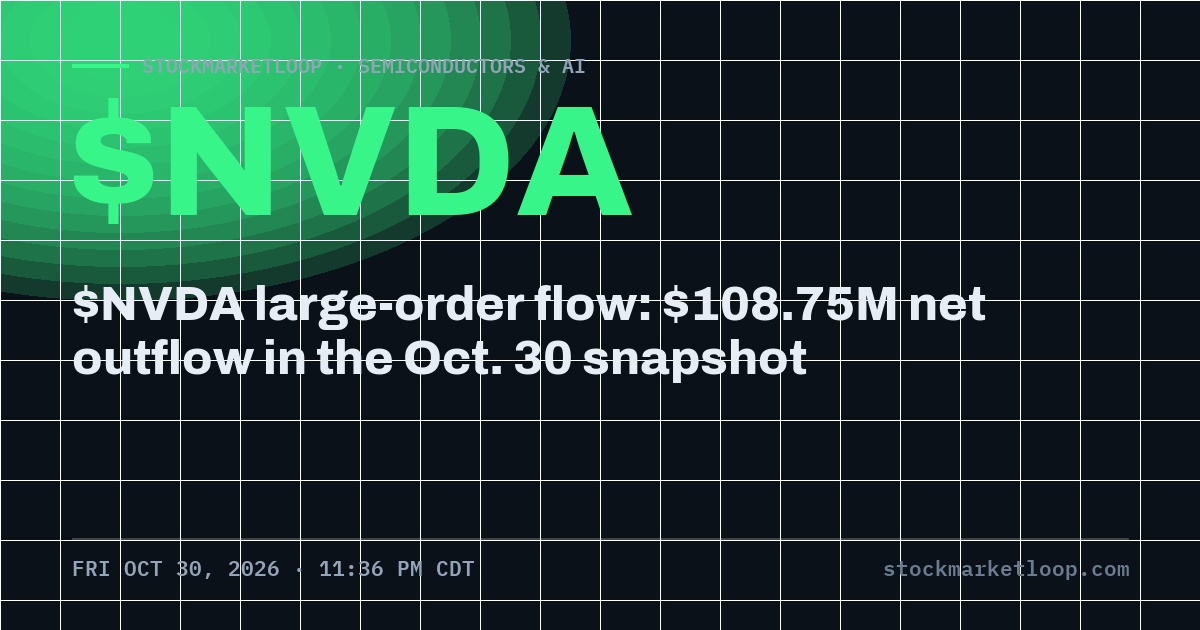
StockMarketLoop’s archived moomoo/OpenD reading for $NVDA recorded $108.75M in large- and extra-large-order net outflow at October 30, 2026, 11:09 AM ET. This is a time-stamped provider classification, not a current quote or a record identifying the investors behind those orders.
What the snapshot actually shows
Nvidia’s large-order and all-order readings were both negative, while the recorded stock move was positive. That combination does not prove that institutions were exiting or that a reversal was imminent. Price and classified flow describe different features of the same trading window.
The table below preserves the figures and timestamp originally stored with this article. It has not been refreshed or re-priced during this editorial correction. Compare its timestamp with any live chart before drawing a conclusion; an intraday snapshot and a later market quote are not interchangeable.
The numbers
| Large-order net | -$108.75M |
|---|---|
| All-order net | -$253.28M |
| Reading time | 2026-10-30 11:09:00 ET |
| Price | $204.64 |
| Move | +0.3% |
| 40-session range | $200.92, $243.37 |
| 20-day average price | $221.46 |
| 20-session change | -12.5% |
How to interpret large-order flow
The provider separates net flow into order-size categories, including large and extra-large orders. A negative reading is classified as net outflow; a positive reading is classified as net inflow. These labels do not identify a hedge fund, an insider, or any other particular trader. They are not evidence of a change in institutional ownership.
Every executed trade has a buyer and a seller. A classified net-flow figure should not be read as money literally leaving the entire market, nor as proof that larger orders are better informed than smaller ones. The category, covered interval and provider’s method all matter.
What would make the reading useful?
Start with a fresh, comparable snapshot from the same source. Check whether the large-order and all-order signs still agree, then compare the price response and trading volume over that same interval. A single reading cannot establish persistence. A change in sign can weaken a proposed interpretation without proving the opposite forecast.
For $NVDA, use the archived range and average in the table as historical context only. Recalculate levels from current, session-consistent data before considering any position. A flow observation alone does not provide an entry, a stop, an expected return, or a suitable position size.
Source and limitations
Snapshot source: StockMarketLoop’s saved direct OpenD capital-flow record. Field definitions: moomoo OpenAPI capital-flow documentation. The documentation explains the fields; it does not independently verify this article’s historical observation.
View the $NVDA stock page or open the chart for a separate, timestamped market view.