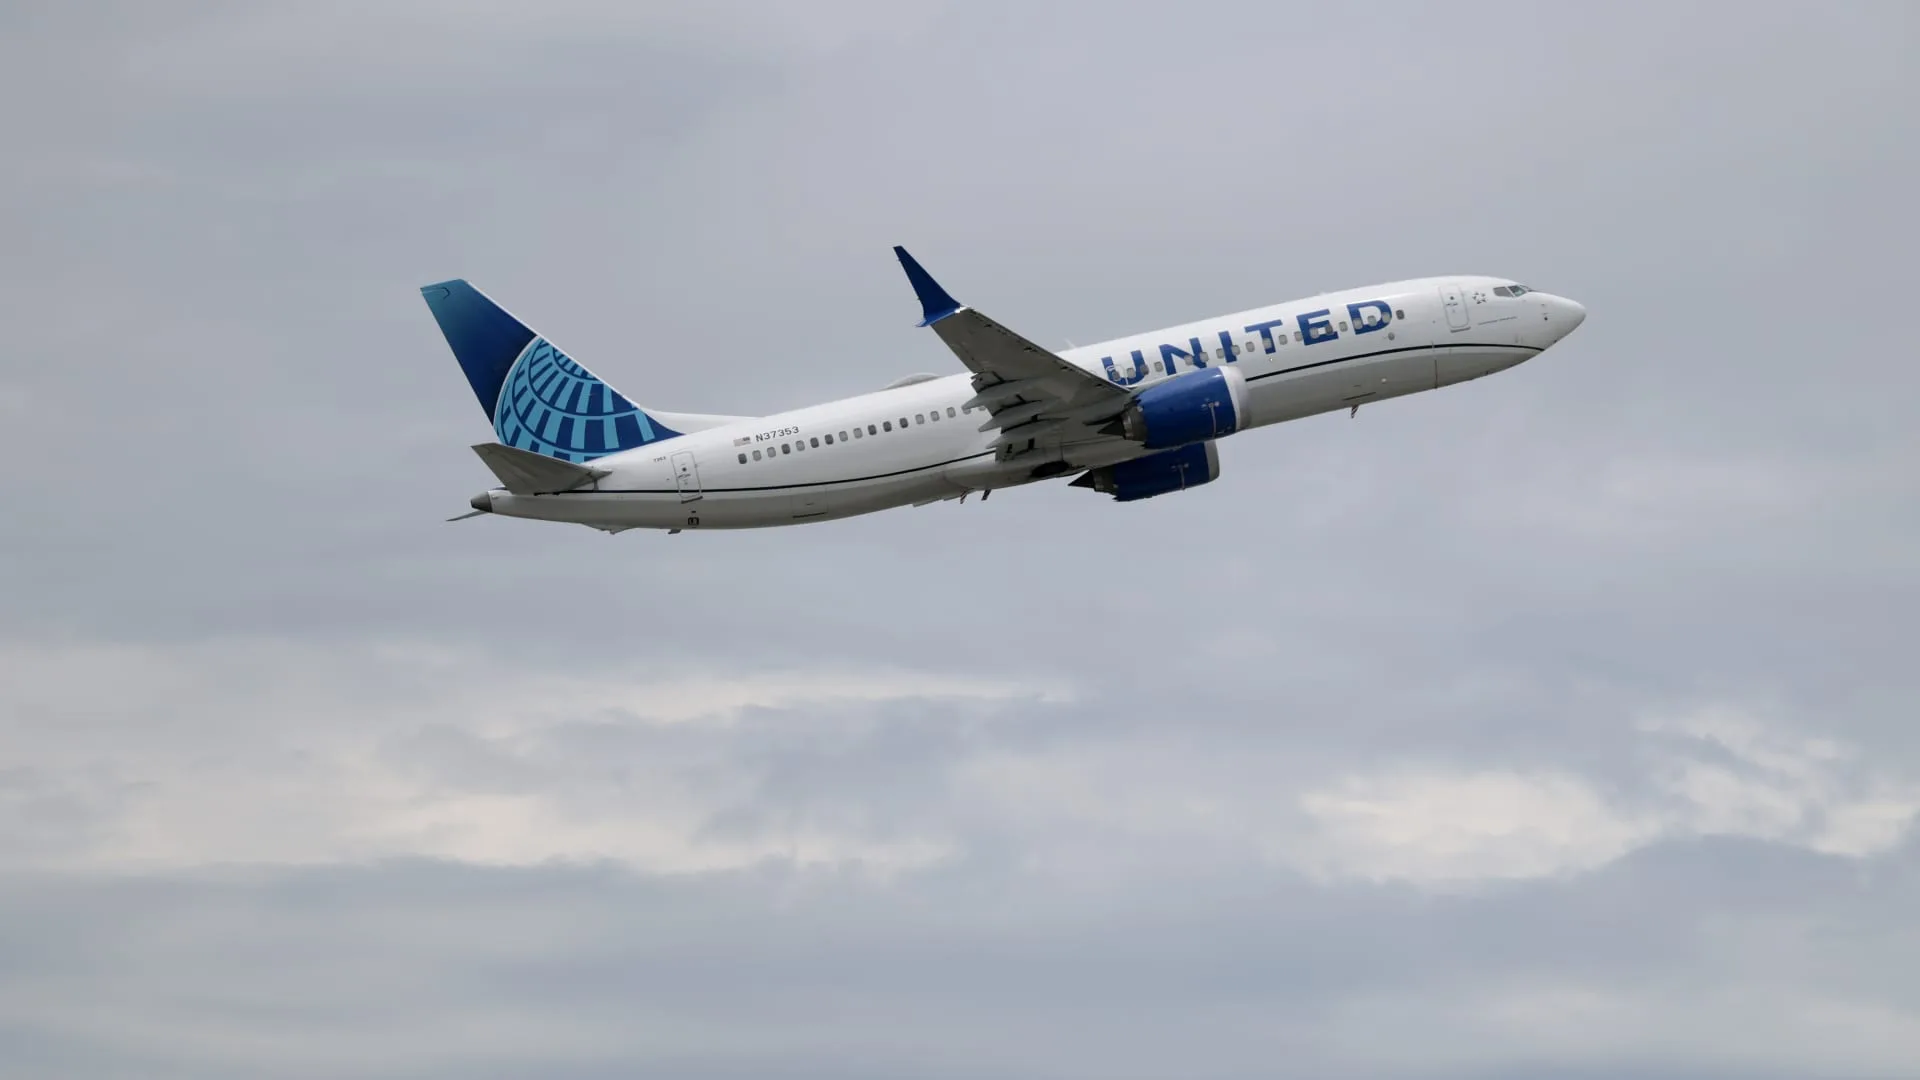
United Airlines reported second-quarter adjusted EPS above expectations but flagged a sharp fuel-cost headwind that could tack nearly $6 billion onto 2026 expenses and pressure future margins.
United Airlines (UAL) posted second-quarter results that topped Wall Street estimates, but the carrier warned that surging jet fuel prices tied to U.S.-Iran hostilities will materially raise costs for the year. The company also updated its near-term profit outlook and signaled the potential for capacity adjustments as it manages the fuel shock.
Forecasts and Fuel Impact
United reported adjusted earnings per share of $1.99 for the quarter ended June 30, above the LSEG consensus of $1.88. Revenue reached $17.67 billion versus $17.61 billion expected. On a GAAP basis, net income fell more than 17% to $805 million, or $2.46 a share; adjusted net income was $649 million, or $1.99 per share.
United set third-quarter adjusted EPS guidance between $2.50 and $3.50, below analysts’ estimate of $3.60. For the full year, management now expects adjusted EPS of $9 to $11 — narrowing and skewing toward the upper end of the $7 to $11 range it trimmed in April after regional geopolitical events.
The airline said jet fuel prices have surged again in July amid intermittent U.S.-Iran conflict. Using Argus data cited by Airlines for America, jet fuel at major U.S. airports rose roughly 34% in July through Tuesday. Based on fuel prices as of Tuesday, United estimated higher fuel costs could add nearly $6 billion to its 2026 expenses versus its start‑of‑year plan. The carrier said second-quarter fuel expense rose 84% year-over-year to $2.3 billion.
United will absorb most of the near-term increase: the company said it expects to cover as much as 90% of the higher fuel costs in the current quarter and all of the added fuel cost in the fourth quarter, using its hedging and pricing actions.
Market Reaction and Capacity
United expanded flying by 3.5% in Q2. Revenue increased 16% year-over-year to $17.67 billion, and total unit revenue rose 12.1% — the strongest unit-revenue growth since early 2023 per FactSet. The carrier reported revenue gains across premium, corporate and basic-economy fares and saw unit-revenue increases for both domestic and international segments.
However, the company noted that the higher fuel outlook could prompt further capacity cuts this year. Management included the most recent fuel-price levels in its updated forecast because of the volatility, and said that since July 1 fuel pricing alone has reduced expected adjusted EPS for the third quarter by $1.12 per share.
Competitive Context
Rival Delta Air Lines (DAL) also reported that it is passing more of the fuel-driven cost increases onto passengers. Both carriers said demand remains resilient despite higher fares, supporting continued pricing power across the industry this summer.
What’s Next
United executives will discuss the results and updated forecasts on an earnings call scheduled for Thursday at 10:30 a.m. ET. Investors will watch commentary on capacity plans, hedging strategy, fare dynamics and the company’s path to fully offsetting the fuel-cost gap.
Key Quotes
- United: second-quarter adjusted EPS $1.99 vs. $1.88 expected (LSEG).
- United: second-quarter fuel costs rose 84% to $2.3 billion.
- United: higher jet fuel could add nearly $6 billion to 2026 expenses based on fuel prices as of Tuesday.
- United: third-quarter adjusted EPS guidance $2.50–$3.50; full-year $9–$11.
Bottom Line for Traders
United’s Q2 results beat estimates and showed healthy revenue trends, but the near-term profit outlook carries significant downside risk from volatile jet fuel. Traders should weigh the company’s stronger unit revenue and demand resilience against the company’s exposed fuel-cost sensitivity and potential capacity adjustments. The upcoming earnings call will be crucial for guidance detail and management’s hedging and pricing plans.
$UAL Live Price, Interactive Charts and Performance Graphs
Market data may be delayed. See StockMarketLoop’s financial disclaimer.
Source: StockMarketLoop