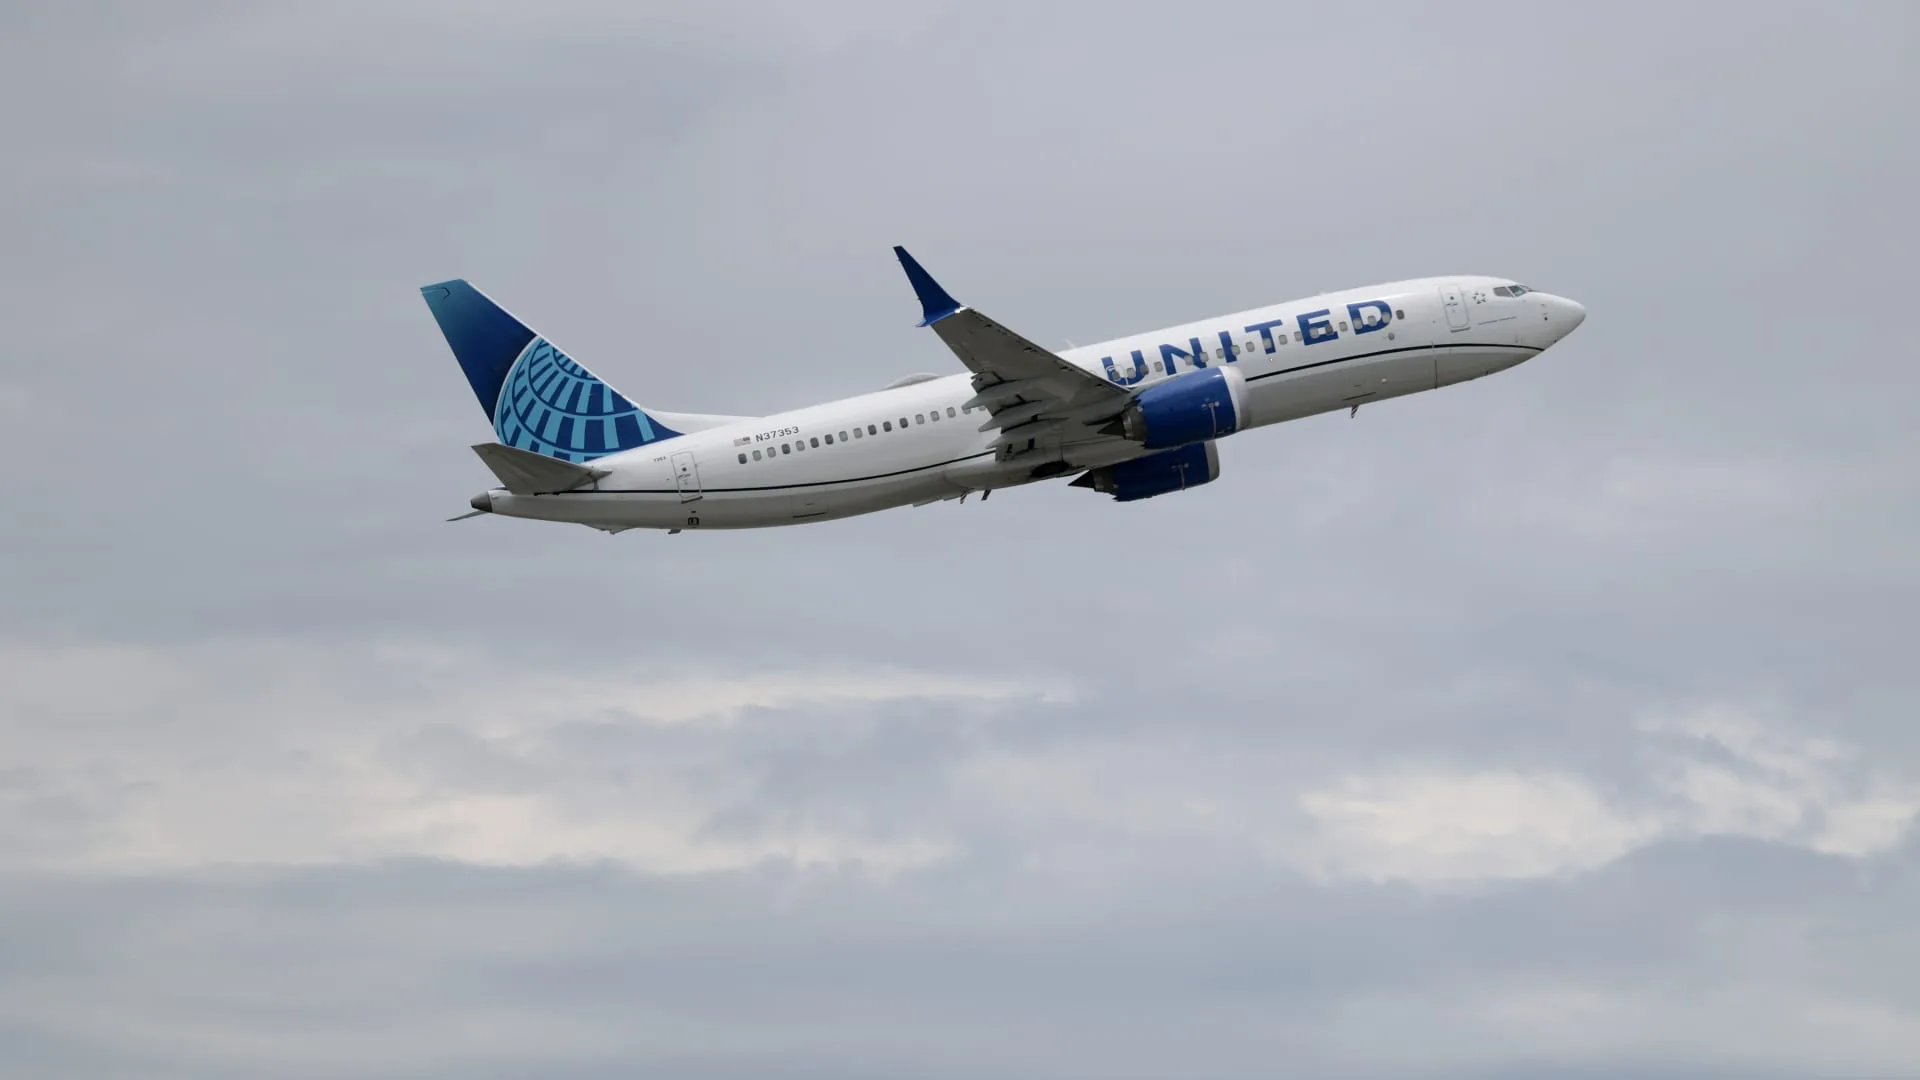
United Airlines (UAL) reported second-quarter adjusted earnings per share above Street estimates but said soaring jet fuel prices could add nearly $6 billion to 2026 costs, forcing capacity and forecast updates.
United Airlines reported second-quarter results for the period ended June 30 that topped Wall Street expectations on adjusted earnings per share and revenue, but the carrier warned that sharply higher jet fuel prices pose a major drag on profitability and could force changes to its capacity plans.
Market Reaction and Fuel Headwind
United said jet fuel costs spiked in July amid renewed U.S.-Iran tensions and volatile supply conditions. Using Argus data published by Airlines for America, the company noted jet fuel at major U.S. airports rose 34% in July through Tuesday. United estimates that, based on Tuesday’s fuel prices, fuel could add nearly $6 billion to the company’s 2026 expense base compared with its expectations at the start of the year. The carrier reported second-quarter fuel expense of $2.3 billion, an 84% increase from a year earlier.
United expects to absorb a substantial portion of the added fuel cost this quarter—up to 90%—and to cover all of the increase in the fourth quarter, according to the company. It also said the July fuel-price move reduced third-quarter adjusted EPS by $1.12 per share under its current assumptions.
Capacity, Demand and Revenues
United expanded its flying 3.5% in the second quarter. Revenue rose 16% year-over-year to $17.67 billion, while total unit revenue increased 12.1% from a year earlier—United’s strongest unit-revenue growth since early 2023, per FactSet data cited in the company release. The airline reported increases in revenue across premium, corporate and basic-economy fares, and said unit revenue rose on both domestic and international routes. Management noted that customers continue to book travel despite higher fares.
Earnings, Income and Guidance
Key reported results versus LSEG estimates: Adjusted earnings per share: $1.99 vs. $1.88 expected; Revenue: $17.67 billion vs. $17.61 billion expected. Net income for the quarter fell more than 17% to $805 million, or $2.46 per share. On an adjusted basis that excludes one-time items, United reported $649 million, or $1.99 per share.
United reiterated a full-year adjusted EPS range of $9 to $11, narrowing to the higher end of a previously announced $7 to $11 window. For the third quarter, the airline forecast adjusted EPS of $2.50 to $3.50, below analysts’ estimate of $3.60.
Peer Context
Rival Delta Air Lines also said it is passing more of rising fuel costs to customers, underscoring an industry-wide push to offset higher operating expenses through higher fares. United flagged that continued fuel volatility could prompt further reductions to planned capacity for the year.
What’s Next
United executives will address results and outlook on an earnings call scheduled for Thursday at 10:30 a.m. ET.
Why It Matters
The airline’s ability to protect margins depends on managing fuel-cost swings and passenger demand resiliency. While United delivered revenue and adjusted EPS beats for the quarter, the near-term earnings outlook faces downward pressure from fuel. For investors and industry watchers, the $6 billion incremental fuel estimate and the company’s guidance cut for Q3 EPS are the primary takeaways—factors that could influence capacity decisions, pricing strategies and margin performance through the remainder of 2026.
Key Quotes
- United: Second-quarter fuel costs rose 84% year over year to $2.3 billion.
- United: Higher fuel prices could add nearly $6 billion to 2026 expenses compared with the start-of-year outlook.
- United: July fuel prices hit third-quarter adjusted EPS by $1.12 per share.
Bottom Line for Traders
United beat expectations on adjusted EPS and revenue in Q2 but flagged a material earnings headwind from jet fuel that narrows its near-term upside. Traders should weigh the company’s stronger unit-revenue performance and persistent demand against the $6 billion fuel-cost shock and the company’s lower Q3 EPS range when assessing risk and relative performance within the airline sector.
$UAL Live Price, Interactive Charts and Performance Graphs
Market data may be delayed. See StockMarketLoop’s financial disclaimer.