
The S&P 500 through $SPY: at $766.48 sits 0.5% under a gamma trigger
Dealers are short gamma and every option open is a same-day expiry, but the buying has not started and a big seller just hit the tape.

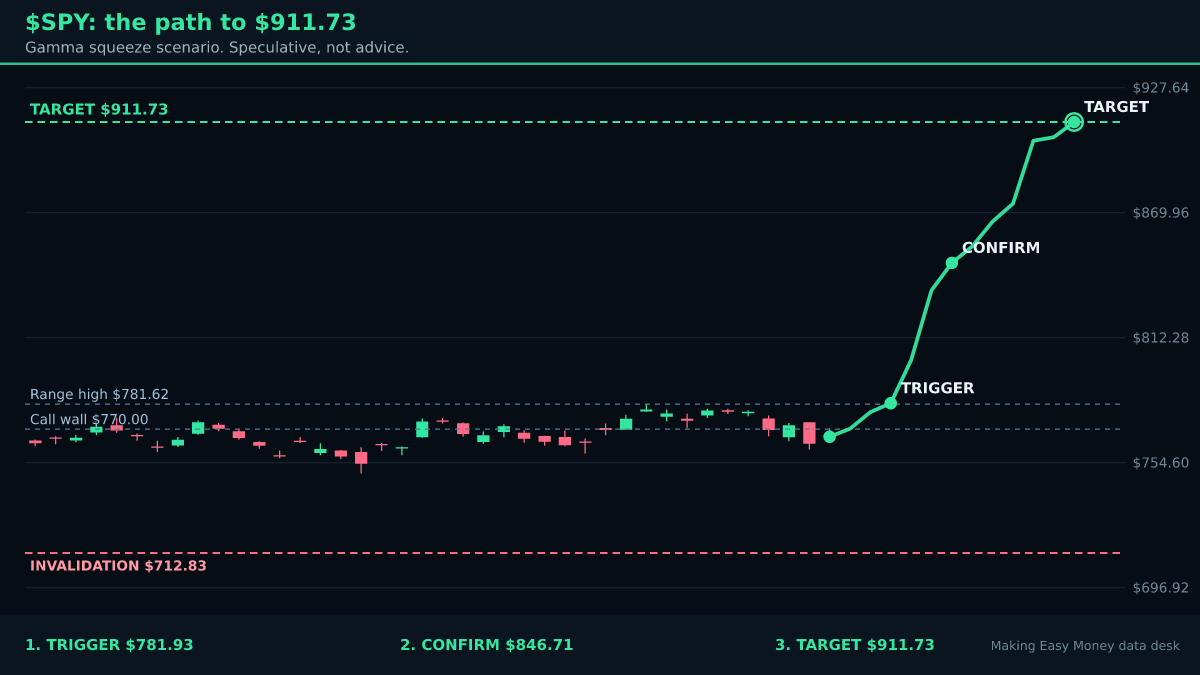
I like this setup more than the tape does. $SPY trades at $766.48, and the call wall at $770.00 is only 0.5% above. Dealers are short gamma, so if price gets there they have to buy into the rise, and if it fails they have to sell into the drop. That is the kind of structure that turns a drift into a run.
But I want to be straight about the state of play. Nothing has happened yet. The gamma is loaded and the hedge buying has not begun. I am leaning bullish on a loaded spring, not on a spring that has been released.
The spring is wound
The number that grabbed me is 26%. That is the share of an average day's volume dealers would have to buy on a move through this zone. For an index product that is extreme pressure, and it does not take a news event to start it. It takes a push.
Then there is the expiry profile. 100% of the open options are same-day. Fuel like that burns fast and hot, and it is what makes the final hours of a session violent when price is sitting near a big strike. Nothing lingers into next week to soften it. Everything gets resolved now.
Above the wall, I see air. The most call open interest is stacked at $770.00, and once price clears it there is not much between there and the supply blocks on the map. That is where squeezes run.
The seller in the room
Now the part that keeps me honest. The biggest off-exchange print is 1,000,000 shares at $766.49, about $766M, and it printed on a downtick. A seller hit. That is one order crossed away from the public book, not a crowd of small trades, and it came in 32% below yesterday's biggest, so by this tape's standards it is merely normal. Still, it is sitting right under the price.
Add 57% of off-exchange prints being short sales and the shorts are clearly active. My squeeze risk score is only 14 of 100, while shorts pressing reads 92 of 100. Days to cover is 2.0 on 98.5M shares short, with short interest up 1.7% since the last report. Nobody looks trapped. Sellers are in control right now.
So why call it bullish? Because the gamma case and the short case are the same case here. If shorts are pressing into a wall where dealers must chase, the pressing becomes the fuel. It only works if price actually breaks through. Until it does, the sellers are simply right.
The bull case
- Dealers short gamma, forced to buy a rise
- Call wall only 0.5% overhead at $770.00
- Hedge pressure at 26% of average daily volume
- Air pocket above the wall
The bear case
- Big seller hit the downtick at $766.49
- Shorts pressing 92 of 100, squeeze risk 14 of 100
- Doji and spinning tops in a flat trend
- $1.85M of $744 put sweeps for Oct 23
What I need to see
The trigger is a push through $770.00 on volume. Not a poke, not a wick. Volume.
The confirmation is call volume outrunning put volume while dealers chase the hedge. I want to watch that happen in real time, not infer it afterward. Note the liquidity map too: $767.24 has dark pool selling stacked, $770.28 is where dealers sell into the call wall, and $771.44 and $773.68 are supply blocks. That is a lot of overhead to chew through before the air pocket opens.
The scenario target is $911.73, up 18.9% over days, and that is where the hedge buying runs out. I know how that looks for an index fund. Treat it as the scenario where the mechanics run all the way, not a forecast I would size to. Most of the value in this idea is in the first leg.
Why I could be wrong
The chart is not helping. The daily shows a doji and spinning tops in a flat trend, which is indecision drawn in candles. Crowd sentiment is neutral at -11 of 100, insiders are quiet, and the backdrop is neutral. Nothing is leaning on this.
I also do not love the recent flow headline: $1.85M of sweep buys on at-the-money $744 puts for Oct 23. That could be a hedge. It could be a view. Either way, somebody paid up for downside, and I would rather respect that than explain it away.
Earnings are listed for today, 2026-10-19, with the options market pricing a 0.1% move. That is a small expected move, which is exactly why a break of the wall would surprise people.
Kill switch
Any one of these and the thesis is over, no averaging down, no renaming it.
- A failed push that closes back under today's low
- A break of $712.83
- A move through $770.00 on thin volume
- Put volume outrunning call volume as price tests the wall
Bottom line
I am bullish, but conditionally, and the condition is a push through $770.00 on volume. Without it, this is a loaded setup and nothing more. With it, I want to be long while dealers are forced to chase.
The desk leans bullish. Bull or bear, the kill switch above is what keeps either call honest.
Sources and further reading: SEC EDGAR filings for SPY · FINRA daily short sale volume files · Nasdaq short interest: SPY · Cboe options quotes: SPY · Nasdaq earnings page: SPY · SPY quote, chart and data on StockMarketLoop.
Data as of Oct 19, 4:11 PM ET from the Making Easy Money Academy data desk: options positioning, FINRA short volume, the off-exchange trade record, the structure map, SEC filings and the ticker's headlines. Vaughn McNair and the Making Easy Money publication may hold or trade positions in the names discussed. This is speculation and education, not financial advice.

Sign up now to get access to the library of members-only issues.
Free. Confirm by email. One click to leave.
Discussion (0)